Django 应用程序调试
这里要介绍的是,全面的 Django app 调试,从最简单的打印变量,到使用 Django 自带的 Debug Middleware 调试 SQL,最后到全面的 Django debug toolbar 的使用。
2. Django debug context processor[1](中级)
3. Django debug toolbar[2](更简单而强大。。。 -_-#)
这是最简单的办法,在启动了 django-admin runserver 后,可将变量打印到终端上,适用于临时性的排错,当然还有其它办法,只是我觉得这种办法最简单。
下面是简单范例。
from pprint import pprint
from django.http import HttpResponse
from myapp.core.models import Case
def index(request, template = 'index.html'):
    c = Case.objects.select_related('author').get(pk = 100)
    pprint(str(c.query)) # 打印 C.objects.get(pk = 100) 调用的 SQL
    pprint(dict(c)) # 打印 C.objects.get(pk = 100) 的世纪内容。
    return HttpResponse(c.__dict__)
二、Django debug context processor[1]
该 Middleware 主要用于调试 SQL 执行情况,能够将所有的数据库查询 SQL 及花费时间打印出来,但是它要求代码使用 RequestContext,普通的 Context 和 render_to_response() 便无法直接使用了,如果之前代码使用 Context 构建,可能需要重写这部分代码。
其实我推荐在开始编写代码的时候,就使用 django.views.generic.simple.direct_to_template 来渲染页面,像如下:
from django.views.generic.simple import direct_to_template

def index(request, template = 'index.html'):
    ...
    return direct_to_template(request, template, {
        'parameters': parameters,
        'case': c,
    })
下面说安装和使用方法:
在 settings.py 的 'TEMPLATE_CONTEXT_PROCESSORS' 段中加入 'django.core.context_processors.debug',如下:
# RequestContext settings

TEMPLATE_CONTEXT_PROCESSORS = (
    'django.core.context_processors.auth',
    'django.core.context_processors.request',
    'django.core.context_processors.media',
    'django.core.context_processors.debug',
    'myapp.core.context_processors.processor',
    ...
)
在 settings.py 中加入 'INTERNAL_IPS',用于识别开发机地址,内容写入本机 IP 地址即可:
# Needed by django.core.context_processors.debug:
# See http://docs.djangoproject.com/en/dev/ref/templates/api/#django-core-context-processors-debug

INTERNAL_IPS = ('127.0.0.1', )
然后,在共享模板的开头(别告诉我你一个页面一个模板文件。。。),加入生成 SQL 列表的代码:
<body id="body">
    	{% if debug %}
	<div id="debug">
		<p>
			{{ sql_queries|length }} Quer{{ sql_queries|pluralize:"y,ies" }}
			{% ifnotequal sql_queries|length 0 %}
			(<span style="cursor: pointer;" onclick="var s=document.getElementById('debugQueryTable').style;s.display=s.display=='none'?'':'none';this.innerHTML=this.innerHTML=='Show'?'Hide':'Show';">Show</span>)
			{% endifnotequal %}
		</p>
		<table id="debugQueryTable" style="display: none;">
			<tr class="odd">
				<td>#</td>
				<td>SQL</td>
				<td>Time</td>
			</tr>
			{% for query in sql_queries %}
			<tr class="{% cycle odd,even %}">
				<td>{{ forloop.counter }}</td>
				<td>{{ query.sql|escape }}</td>
				<td>{{ query.time }}</td>
			</tr>{% endfor %}
		</table>
	</div>
	{% endif %}
        ...
</body>
最终生成的效果是在页面顶部,增加了一个 XX Quueries 项,点击 (Show) 后如下:

Django debug toolbar 是我到目前为止见过的安装最简单,功能最强大的调试工具,它的主要特性有:
* 更加完善的 SQL 调试(比 Django debug processor 更加精准,Django debug contect processor 无法处理关系查询(Select related))
* 记录 CPU 使用时间(可惜没有针对代码级的 profile,希望未来的版本能增加这个功能)
* 完整记录 HTTP Headers 和 Request 请求
* 完整记录模板 Context 内容,包括 RequestContext 和直接传入的变量
* 记录 Signals
* python logging 模块的日志支持
安装也比较简单,可以使用 yum 直接安装,也从上面的地址下载后,直接使用 setuptools 通用的安装方法安装即可。
$ tar zxvf robhudson-django-debug-toolbar-7ba80e0.tar.gz
$ cd robhudson-django-debug-toolbar-7ba80e0
$ python ./setup.py build
$ sudo python ./setup.py install
如需确保安装正常,从 Python shell 里看看能否 import 即可,不出错,即安装正常:
$ python
Python 2.6.1 (r261:67515, Feb 11 2010, 00:51:29)
[GCC 4.2.1 (Apple Inc. build 5646)] on darwin
Type "help", "copyright", "credits" or "license" for more information.
>>> import debug_toolbar
>>>
然后是配置你的 settings.py。
我的调试 settings.py 和在产品服务器上运行的是不一样的,我也建议最好将二者分开,因为 Django app 开启 Debug 后对性能损耗非常严重。
将下面红字加入你自己的 settings.py 文件:
MIDDLEWARE_CLASSES = (
    ...
    'debug_toolbar.middleware.DebugToolbarMiddleware',
)

INSTALLED_APPS = (
    ...
    'debug_toolbar'
)

TEMPLATE_DIRS = (
    ...
    '/Library/Python/2.6/site-packages/django_debug_toolbar-0.8.3-py2.6.egg/debug_toolbar/templates/', #按需修改!指向 debug_toolbar 的模板目录。
)

DEBUG_TOOLBAR_PANELS = (
             'debug_toolbar.panels.version.VersionDebugPanel',
             'debug_toolbar.panels.timer.TimerDebugPanel',
             'debug_toolbar.panels.settings_vars.SettingsVarsDebugPanel',
             'debug_toolbar.panels.headers.HeaderDebugPanel',
             'debug_toolbar.panels.request_vars.RequestVarsDebugPanel',
             'debug_toolbar.panels.template.TemplateDebugPanel',
             'debug_toolbar.panels.sql.SQLDebugPanel',
             'debug_toolbar.panels.signals.SignalDebugPanel',
             'debug_toolbar.panels.logger.LoggingPanel'
  )
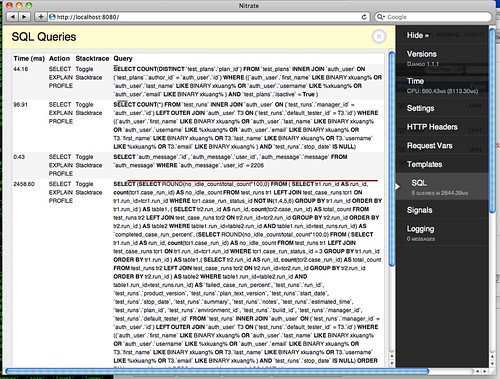
然后使用 django-admin.py runserver 启动测试服务器,下图是 Django debug toolbar 的 SQL 查询页面。
相关链接:
[1] http://www.djangosnippets.org/snippets/93/
[2] http://github.com/robhudson/django-debug-toolbar/downloads